

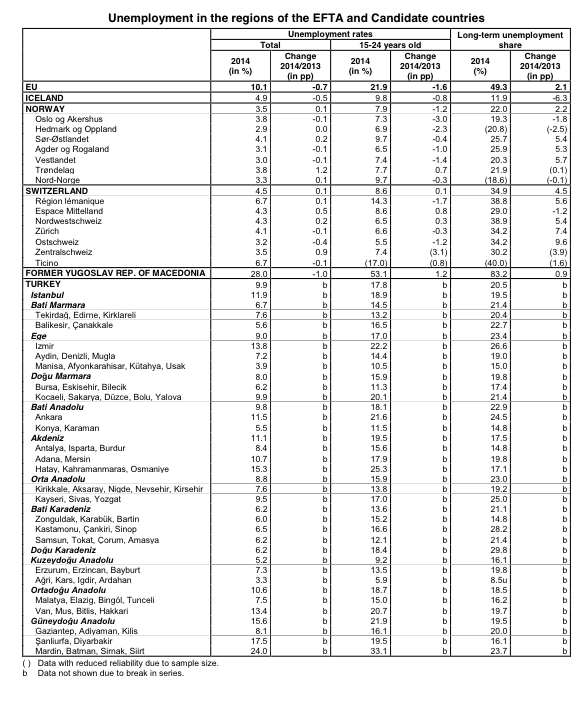
Unemployment in the EU regions Unemployment rates fell in the majority of the EU regions in 2014
Just over half of the NUTS 2 regions1 of the European Union (EU) recorded a decrease of at least 0.5 percentage points5 in their regional unemployment rate3 in 2014 compared with 2013. However, regional unemployment rates continued to vary widely across the EU regions in 2014, with the lowest rates recorded in the regions of Praha in the Czech Republic and Oberbayern in Germany (both 2.5%), followed by Tübingen, Oberpfalz, Niederbayern and Unterfranken (all situated in Germany and all below 3.0%). At the opposite end of the scale, the highest unemployment rates were registered in five Spanish regions: Andalucía (34.8%), Canarias (32.4%), Ceuta (31.9%), Extremadura (29.8%) and Castilla-la Mancha (29.0%).
These data3 on regional unemployment, compiled on the basis of the EU Labour Force Survey, are published by Eurostat, the statistical office of the European Union. A dedicated article5 is also available on Eurostat website.

In this map, the regions have been grouped into quartiles, that is four approximately equal categories.
One in five EU regions with unemployment rate below 5%
Among the EU regions, 54 had an unemployment rate of 5.0% or less in 2014, half the average of the EU (10.1%). They included twenty-three regions in Germany, sixteen in the United Kingdom, six in Austria, three each in Belgium and Romania and one each in the Czech Republic, Italy and Hungary. In contrast, 29 regions had a rate of at least 20.2%, double that of the EU: thirteen regions in Spain, twelve in Greece and four in Italy

Youth unemployment rates varied from 3.7% in Oberbayern to almost 70% in Ipeiros
In 2014, the average unemployment rate for young people3 aged between 15 and 24 in the EU was 21.9%. Regional differences in the unemployment rate for young people are however very marked. In the EU in 2014, the lowest rates for young people were recorded in the German regions of Oberbayern (3.7%), Stuttgart (4.7%), Karlsruhe (4.8%) and Freiburg (5.0%), and the highest in Ipeiros (69.8%) in Greece and Ceuta (67.5%) in Spain. In half of the EU regions, the unemployment rate for young people was at least twice that of total unemployment.
Regions with highest and lowest unemployment rates in 2014, %

In almost 1 out of 3 regions, the majority of the unemployed had been out of work for at least a year
The long-term unemployment share, which is defined as the percentage of unemployed persons who have been unemployed for 12 months or more, stood at 49.3% on average in the EU in 2014. In the EU regions, the lowest shares of long-term unemployed were recorded in 2014 in Övre Norrland (14.8%) in Sweden and Bucuresti – Ilfov (15.9%) in Romania, followed by six other Swedish regions. On the other hand, the highest shares were registered in 2014 in six regions in Greece: Attiki (77.3%), Dytiki Ellada (76.7%), Ipeiros (75.8%), Kentriki Makedonia (75.2%), Peloponnisos (73.8%) and Thessalia (73.5%).
Regions with highest and lowest long-term unemployment shares in 2014, %
|
Lowest |
Highest |
||||
|
1 |
Övre Norrland (SE) |
14.8 |
1 |
Attiki (EL) |
77.3 |
|
2 |
Bucuresti – Ilfov (RO) |
15.9 |
2 |
Dytiki Ellada (EL) |
76.7 |
|
3 |
Mellersta Norrland (SE) |
16.3 |
3 |
Ipeiros (EL) |
75.8 |
|
4 |
Småland med öarna (SE) |
16.6 |
4 |
Kentriki Makedonia (EL) |
75.2 |
|
5 |
Västsverige (SE) |
17.4 |
5 |
Peloponnisos (EL) |
73.8 |
|
6 |
Stockholm (SE) |
17.5 |
6 |
Thessalia (EL) |
73.5 |
|
7 |
Östra Mellansverige (SE) |
17.7 |
7 |
Východné Slovensko (SK) |
72.8 |
|
8 |
Norra Mellansverige (SE) |
18.4 |
8 |
Sterea Ellada (EL) |
72.2 |
|
9 |
Pohjois- ja Itä-Suomi (FI) |
20.9 |
9 |
Ciudad Autónoma de Ceuta (ES) |
72.0 |
|
10 |
Nordjylland (DK) |
21.0 |
10 |
Západné Slovensko (SK) |
71.2 |
- These data are based on the Nomenclature of Territorial Units for Statistics (NUTS) as modified in January 2011. NUTS 2010 provides a uniform, consistent breakdown of territorial units for the production of regional statistics for the EU. Level 2 of the nomenclature has 272 regions: Belgium (11), Bulgaria (6), the Czech Republic (8), Denmark (5), Germany (38), Ireland (2), Greece (13), Spain (19), France (26), Croatia (2), Italy (21), Hungary (7), the Netherlands (12), Austria (9), Poland (16), Portugal (7), Romania (8), Slovenia (2), Slovakia (4), Finland (5), Sweden (8) and the United Kingdom (37). Estonia, Cyprus, Latvia, Lithuania, Luxembourg and Malta are all considered as single regions at NUTS 2 level. For a list of the European statistical regions see: http://ec.europa.eu/eurostat/web/nuts/overview
The statistical regions in the candidate and EFTA countries follow the principles of the NUTS classification; however there is no legal base. There are 44 regions in these countries at Level 2: Norway (7), Switzerland (7), and Turkey (26). Iceland, Liechtenstein, Montenegro and the former Yugoslav Republic of Macedonia are all considered as single regions at Level 2.
- The 0.5 percentage point threshold is an arbitrary choice, above which changes are considered as significant in most of the regions in this release. However, depending on the survey design and the population structure of each region, the margin of error can vary and sometimes be above this threshold in some regions.
- The unemployment rate is defined as the percentage of unemployed persons aged 15-74 in the economically active population. According to the recommendations of the International Labour Organisation, a person is deemed to be unemployed if all three of the following conditions are met:
- he or she is without work during the survey reference week;
- he or she is available for work, being able to take up employment within two weeks;
- he or she has actively sought work over the past four weeks.
In particular, it should be noted that the youth unemployment rate does not reflect the proportion of all young people who are unemployed, as not every young person participates in the labour market. Labour market participation of young persons varies by country and region in the EU, which influences the proportion of unemployed people in the total youth population. For further details please refer to the Youth unemployment article in Statistics Explained: http://ec.europa.eu/eurostat/statistics-explained/index.php/Youth_unemployment
The EU average is calculated as the average of the regional values. The figures may slightly differ from the EU unemployment rate published in the Eurostat database, for which methodological breaks have been corrected.
- For further regional data, please see the Eurostat web site: http://ec.europa.eu/eurostat/web/regions/data/database. For interactive maps on regional unemployment, visit Regional Statistics Illustrated: http://ec.europa.eu/eurostat/cache/RSI/#?vis=nuts2.labourmarket
- Eurostat, Statistics Explained article “Unemployment statistics at regional level” available on Eurostat’s website: http://ec.europa.eu/eurostat/statistics-explained/index.php/Unemployment_statistics_at_regional_level


Issued by: Eurostat Press Office